
Building an AI Agent Performance Dashboard that Leaders Actually Use
#90: From outcome-first metrics to an executive-ready UI—how we built it, why it works, and how to ship your own.


Table of contents
What we set out to build
The shortest possible build plan (6 steps)
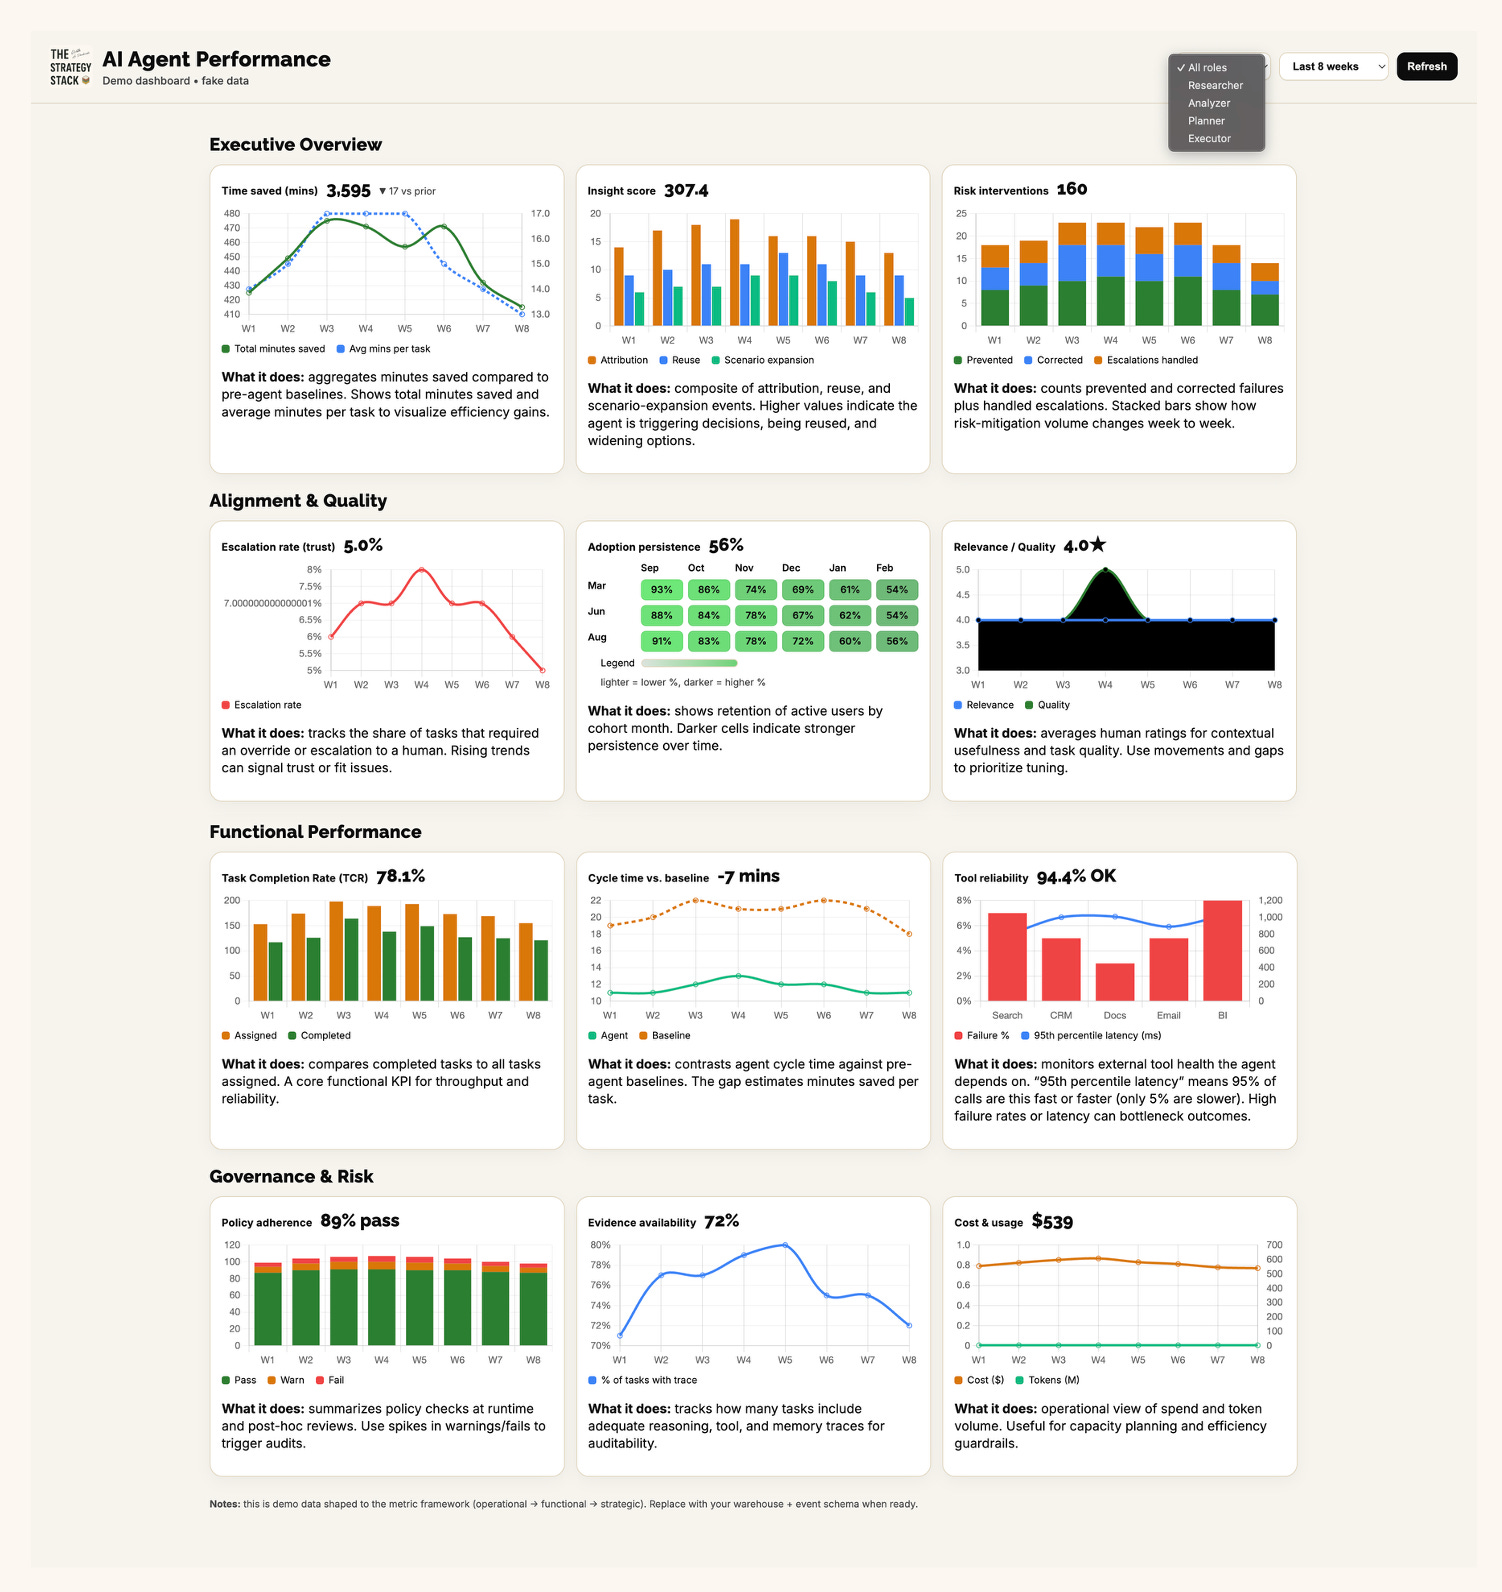
The dashboard concept: what to show—and why
The data model you’ll need
Visual + interaction choices (and the brand touch)
How this maps to the book—and what matters for leadership
1) What we set out to build (in 20-30 mins.)
An executive-friendly dashboard that proves agent value, not model activity. The north star is simple: elevate time saved, insight generated, and risk mitigated—the three enterprise outcomes that matter once agents are in real workflows. Token counts and latency still exist, but they’re backstage.
2) The shortest possible build plan (6 steps)
Here’s the quick, end-to-end checklist of how we arrived at the dashboard mockup (including the design work up front) using ChatGPT (only):
Step 1 — Define success by outcomes.
Lock your top-line KPIs: time saved, insight events, and risk interventions. Keep “alignment” signals (trust, relevance, utility) for diagnostic depth.
Step 2 — Instrument the events.
Log task lifecycle, tool calls, memory reads/writes, escalations/overrides, and governance checks. These traces enable auditability and learning loops later.
Step 3 — Stand up a minimal warehouse schema.
Dimensions for agents/users/use cases; facts for tasks, task events, tool calls, memory events, feedback, governance audits, interventions, and attribution. (A starter SQL/LookML pack is linked below.)
Step 4 — Create a truthful demo.
Generate fake—but structurally realistic—series for each KPI so executives can see the story before production data lands.
Step 5 — Ship the executive row first.
Put Time saved, Insight score, and Risk interventions side-by-side as your landing view. Everything else drills down.
Step 6 — Add the operating ritual.
Wire exports to support Quarterly Agent Strategy Reviews (QASRs) so teams can revisit scope, behavior, metrics, governance, and opportunities with a fixed cadence.
