


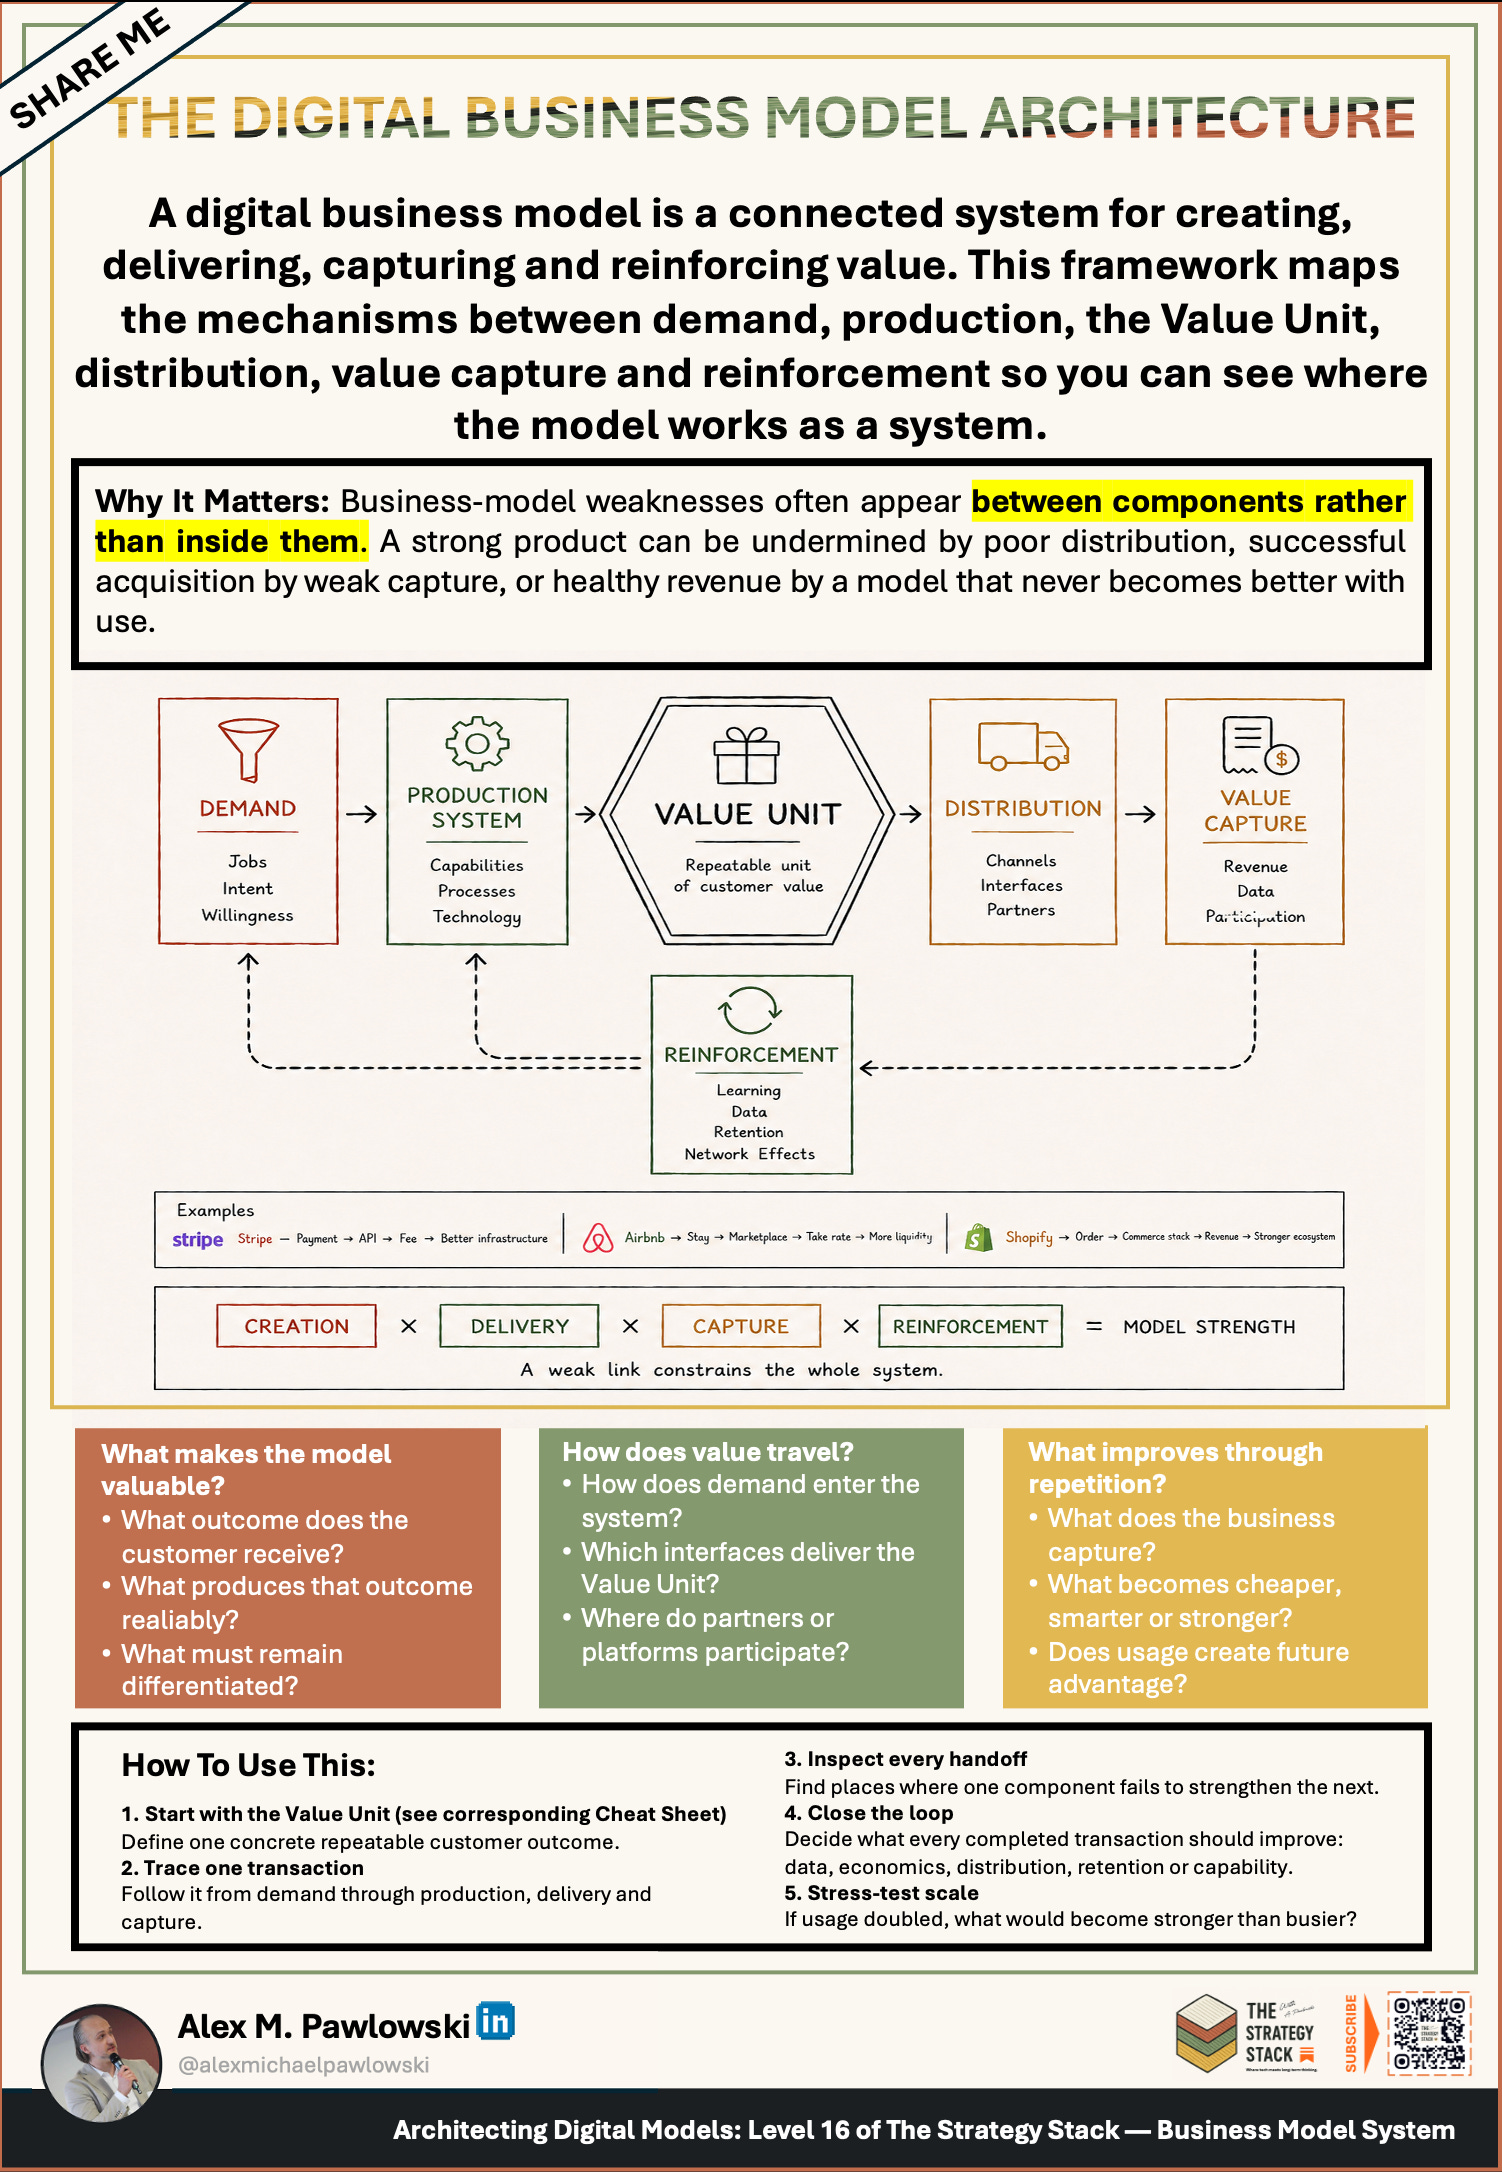
A digital business model is not a slide with revenue streams.
It is a connected system for creating, delivering, capturing, and reinforcing value.
Weaknesses rarely appear inside components. They appear between them — where demand fails to convert, production fails to deliver the value unit, distribution fails to reach the right interface, or capture fails to fund what should improve with each transaction.
A strong product undermined by poor distribution. Healthy acquisition undermined by weak capture. Solid revenue undermined by a model that never compounds.
The architecture map makes those handoffs visible.
The Model
Five components form the main flow:
Demand — Jobs, intent, willingness. How need enters the system.
Production system — Capabilities, processes, technology. How the value unit is produced reliably.
Value unit — The repeatable unit of customer value. The pivot everything else orbits.
Distribution — Channels, interfaces, partners. How the value unit reaches the customer.
Value capture — Revenue, data, participation. What the business retains from each transaction.
Beneath the flow sits reinforcement — learning, data, retention, network effects — feeding back into demand, production, and distribution.
A Useful Heuristic (Not a Formula)
It helps to think of model strength as multiplicative:
Creation × Delivery × Capture × Reinforcement → Model strength
This is a diagnostic model, not literal mathematics. The point is that a weak link constrains the whole system — a strong product with broken distribution still underperforms; healthy revenue without reinforcement still stagnates.
Use it to ask: which link is weakest, and which handoff is leaking value?
Handoff Failures
Systems fail at the seams:
Demand arrives but production cannot deliver the value unit at quality
Production works but distribution is rented and expensive
Distribution scales but capture leaves no margin for reinforcement
Revenue grows but nothing learned improves the next cycle
Teams optimize components in isolation. Architecture work inspects transitions.
Twilio: Message delivered → usage API → metered fee → denser developer infrastructure
Tripadvisor: Review contributed → discovery surface → advertising / booking take → more content liquidity
Figma: Collaborative design session → team workspace → seat revenue → stronger multiplayer defaults
Each pattern is designed so completed transactions improve something downstream — not only register revenue.
How to Use This Framework
1. Start with the value unit
Define one concrete repeatable customer outcome.
2. Trace one transaction
Follow it from demand through production, delivery, and capture.
3. Inspect every handoff
Where does one component fail to strengthen the next?
4. Close the loop
Decide what every completed transaction should improve: data, economics, distribution, retention, or capability.
5. Stress-test scale
If usage doubled, what would become stronger — not just busier?
👉 Unlock the Strategy Stack
…and access the Business Model Series, advanced Cheat Sheets, the Operator Vault, and various essays at the intersection of strategy and technology.
In this series →

Read next →

Go deeper →

